Production Monitoring for Saros Applications
Goal: Implement comprehensive monitoring that prevents costly failures and ensures optimal user experienceProduction DeFi applications require robust monitoring to detect issues before they impact users. This guide provides battle-tested monitoring strategies used by successful Saros-powered applications handling millions in daily volume.
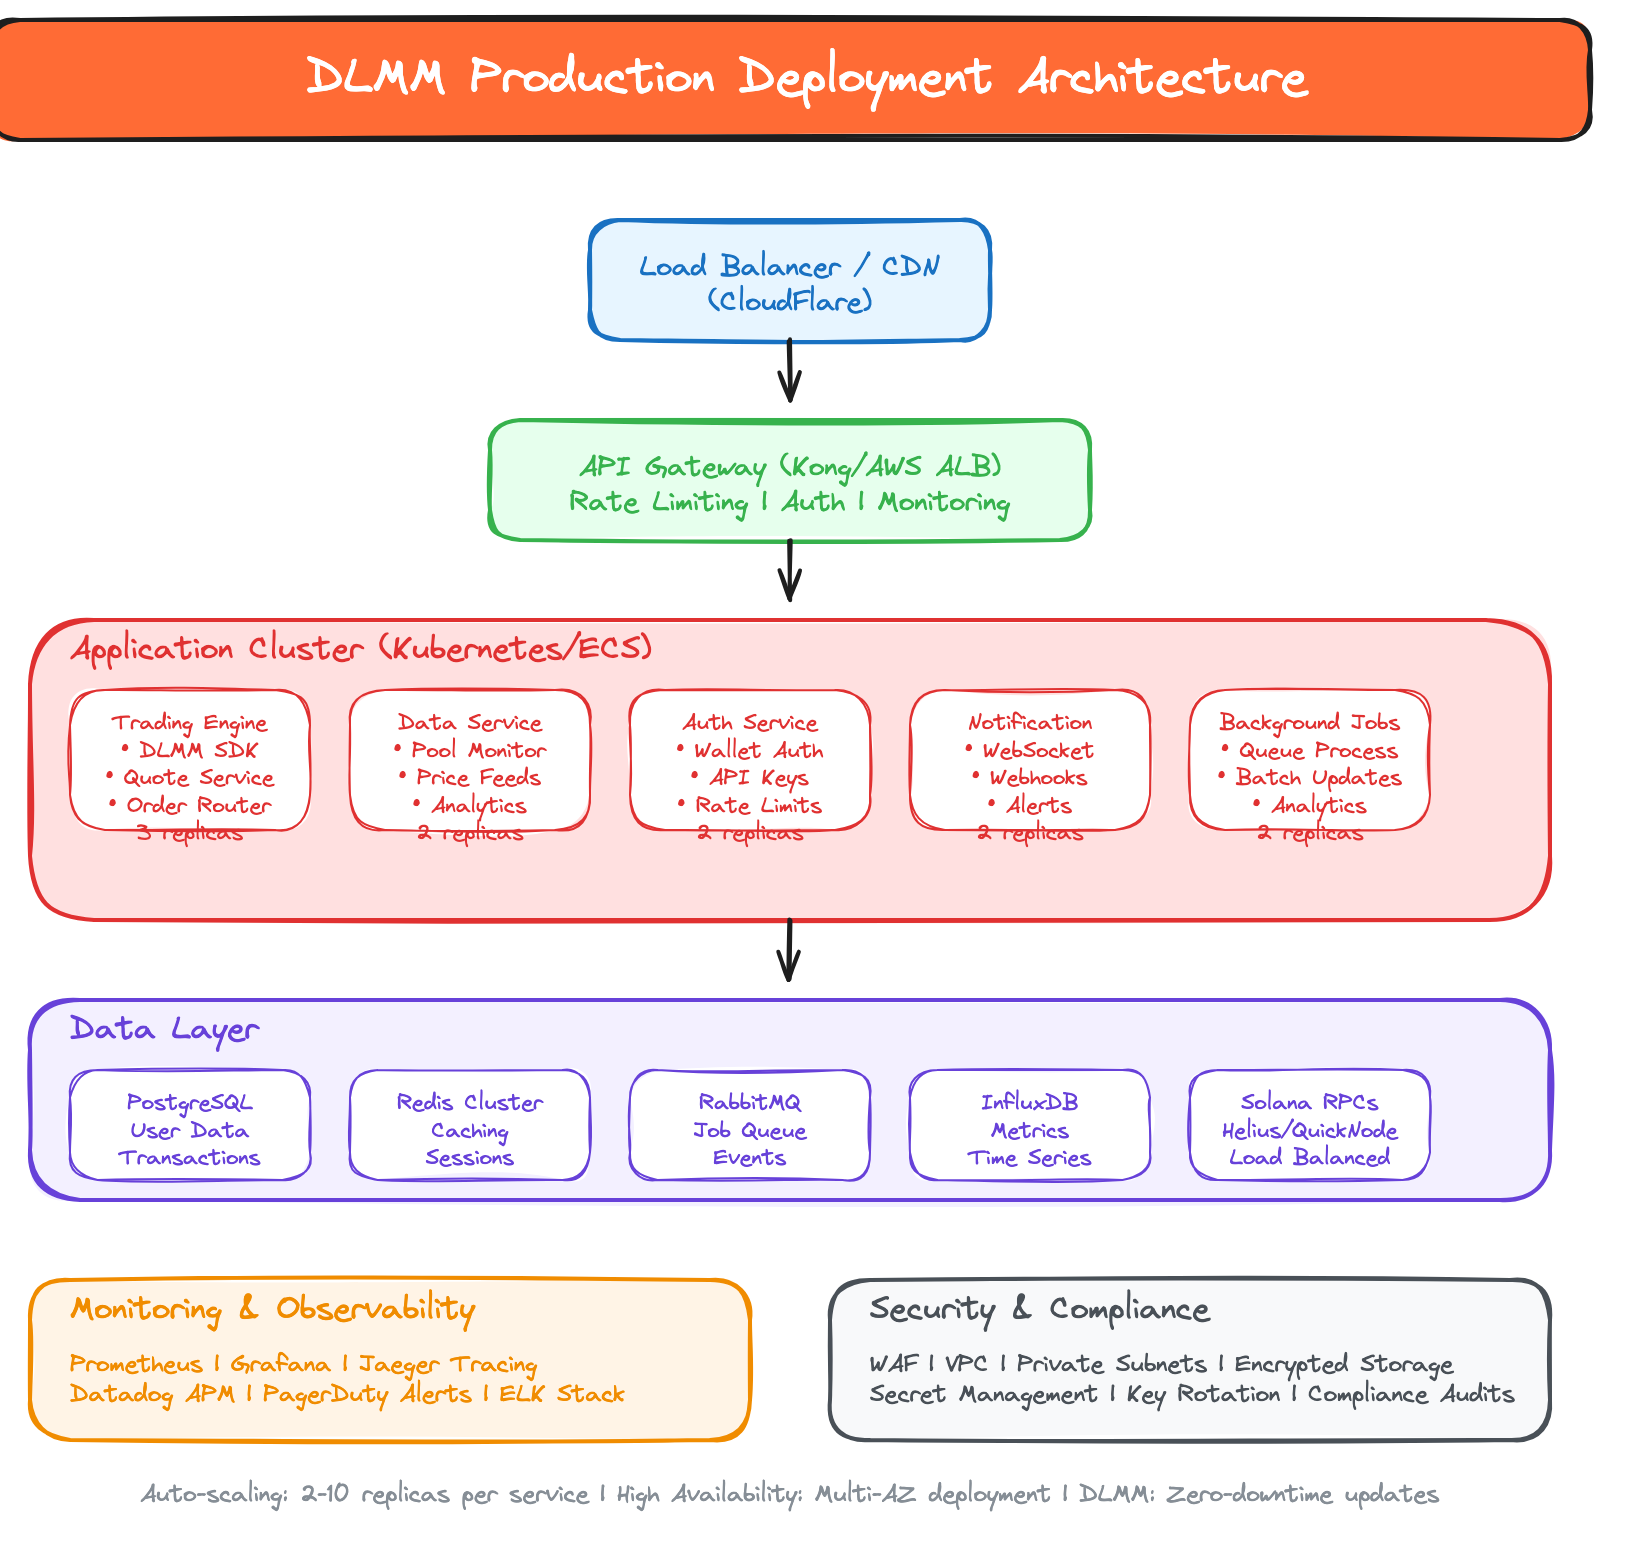
Monitoring Architecture Overview
Core Monitoring Components
1. Saros-Specific Metrics Collection
Copy
// monitoring/SarosMetrics.ts
import { EventEmitter } from 'events';
import { Connection, PublicKey } from '@solana/web3.js';

interface SwapMetrics {
  timestamp: number;
  pair: string;
  amountIn: number;
  amountOut: number;
  priceImpact: number;
  gasUsed: number;
  latency: number;
  success: boolean;
  errorCode?: string;
  userId?: string;
}

interface PoolMetrics {
  poolAddress: string;
  timestamp: number;
  tvl: number;
  volume24h: number;
  fees24h: number;
  activeUsers: number;
  averageTradeSize: number;
}

class SarosMetricsCollector extends EventEmitter {
  private metrics: SwapMetrics[] = [];
  private poolMetrics: Map<string, PoolMetrics> = new Map();
  private connection: Connection;

  constructor(connection: Connection) {
    super();
    this.connection = connection;
    this.startPoolMonitoring();
  }

  // Track individual swap performance
  recordSwap(swap: SwapMetrics) {
    this.metrics.push(swap);
    this.emit('swap', swap);

    // Alert on high slippage
    if (swap.priceImpact > 5) {
      this.emit('alert', {
        type: 'HIGH_SLIPPAGE',
        message: `High slippage detected: ${swap.priceImpact.toFixed(2)}%`,
        severity: 'warning',
        metadata: swap
      });
    }

    // Alert on swap failures
    if (!swap.success) {
      this.emit('alert', {
        type: 'SWAP_FAILURE',
        message: `Swap failed: ${swap.errorCode}`,
        severity: 'error',
        metadata: swap
      });
    }

    // Alert on high latency
    if (swap.latency > 10000) { // 10 seconds
      this.emit('alert', {
        type: 'HIGH_LATENCY',
        message: `Slow swap execution: ${swap.latency}ms`,
        severity: 'warning',
        metadata: swap
      });
    }

    // Cleanup old metrics (keep last 1000)
    if (this.metrics.length > 1000) {
      this.metrics = this.metrics.slice(-1000);
    }
  }

  // Monitor pool health
  private async startPoolMonitoring() {
    setInterval(async () => {
      try {
        await this.collectPoolMetrics();
      } catch (error) {
        this.emit('alert', {
          type: 'POOL_MONITORING_ERROR',
          message: `Pool monitoring failed: ${error.message}`,
          severity: 'error',
          metadata: { error }
        });
      }
    }, 60000); // Every minute
  }

  private async collectPoolMetrics() {
    // Track key pools used by your application
    const keyPools = [
      'YourUSDCSOLPoolAddress',
      'YourOtherPoolAddress'
    ];

    for (const poolAddress of keyPools) {
      try {
        const poolData = await this.fetchPoolData(poolAddress);
        this.poolMetrics.set(poolAddress, poolData);

        // Check for pool health issues
        this.checkPoolHealth(poolData);

      } catch (error) {
        this.emit('alert', {
          type: 'POOL_DATA_ERROR',
          message: `Failed to fetch pool data for ${poolAddress}`,
          severity: 'error',
          metadata: { poolAddress, error }
        });
      }
    }
  }

  private async fetchPoolData(poolAddress: string): Promise<PoolMetrics> {
    // Implement actual pool data fetching using Saros SDK
    // This is a simplified example

    return {
      poolAddress,
      timestamp: Date.now(),
      tvl: 1000000, // Fetch actual TVL
      volume24h: 500000, // Fetch actual 24h volume
      fees24h: 2500, // Fetch actual fees
      activeUsers: 150, // Fetch active user count
      averageTradeSize: 3333 // Calculate average trade size
    };
  }

  private checkPoolHealth(pool: PoolMetrics) {
    // Alert on low liquidity
    if (pool.tvl < 100000) { // Less than $100k TVL
      this.emit('alert', {
        type: 'LOW_LIQUIDITY',
        message: `Low TVL in pool ${pool.poolAddress}: $${pool.tvl.toLocaleString()}`,
        severity: 'warning',
        metadata: pool
      });
    }

    // Alert on unusual volume drops
    const historical = this.getHistoricalVolume(pool.poolAddress);
    if (historical && pool.volume24h < historical * 0.3) {
      this.emit('alert', {
        type: 'VOLUME_DROP',
        message: `Significant volume drop in pool ${pool.poolAddress}`,
        severity: 'warning',
        metadata: { current: pool.volume24h, historical }
      });
    }
  }

  // Get business metrics
  getBusinessMetrics(timeframe: 'hour' | 'day' | 'week' = 'day') {
    const now = Date.now();
    const cutoff = {
      hour: now - 60 * 60 * 1000,
      day: now - 24 * 60 * 60 * 1000,
      week: now - 7 * 24 * 60 * 60 * 1000
    }[timeframe];

    const recentSwaps = this.metrics.filter(m => m.timestamp > cutoff);
    const successfulSwaps = recentSwaps.filter(m => m.success);

    return {
      totalSwaps: recentSwaps.length,
      successfulSwaps: successfulSwaps.length,
      successRate: successfulSwaps.length / Math.max(recentSwaps.length, 1),
      totalVolume: successfulSwaps.reduce((sum, s) => sum + s.amountIn, 0),
      averageSlippage: successfulSwaps.reduce((sum, s) => sum + s.priceImpact, 0) / Math.max(successfulSwaps.length, 1),
      averageLatency: successfulSwaps.reduce((sum, s) => sum + s.latency, 0) / Math.max(successfulSwaps.length, 1),
      uniqueUsers: new Set(recentSwaps.map(s => s.userId).filter(Boolean)).size
    };
  }

  private getHistoricalVolume(poolAddress: string): number | null {
    // Implement historical volume lookup
    // This would typically query your database or external API
    return null;
  }
}

// Export singleton instance
export const sarosMetrics = new SarosMetricsCollector(
  new Connection(process.env.SOLANA_RPC_URL!)
);
2. Enhanced Swap Service with Monitoring
Copy
// services/MonitoredSwapService.ts
import { sarosMetrics } from '../monitoring/SarosMetrics';

class MonitoredSwapService {
  private dlmmService: any; // Your Saros DLMM service

  constructor(dlmmService: any) {
    this.dlmmService = dlmmService;
  }

  async executeSwap(params: SwapParams) {
    const startTime = Date.now();
    const swapId = `swap_${Date.now()}_${Math.random().toString(36).substr(2, 9)}`;

    try {
      // Pre-swap validation
      await this.preSwapChecks(params);

      // Execute the actual swap
      const result = await this.dlmmService.swap(params);

      // Record successful swap metrics
      const metrics: SwapMetrics = {
        timestamp: Date.now(),
        pair: `${params.tokenA}-${params.tokenB}`,
        amountIn: params.amountIn,
        amountOut: result.amountOut,
        priceImpact: result.priceImpact,
        gasUsed: result.gasUsed,
        latency: Date.now() - startTime,
        success: true,
        userId: params.userId
      };

      sarosMetrics.recordSwap(metrics);

      // Log successful swap
      console.log(`✅ Swap completed: ${swapId}`, {
        pair: metrics.pair,
        volume: metrics.amountIn,
        latency: metrics.latency,
        priceImpact: metrics.priceImpact
      });

      return result;

    } catch (error: any) {
      // Record failed swap metrics
      const metrics: SwapMetrics = {
        timestamp: Date.now(),
        pair: `${params.tokenA}-${params.tokenB}`,
        amountIn: params.amountIn,
        amountOut: 0,
        priceImpact: 0,
        gasUsed: 0,
        latency: Date.now() - startTime,
        success: false,
        errorCode: error.code || 'UNKNOWN_ERROR',
        userId: params.userId
      };

      sarosMetrics.recordSwap(metrics);

      // Enhanced error logging
      console.error(`❌ Swap failed: ${swapId}`, {
        pair: metrics.pair,
        error: error.message,
        errorCode: error.code,
        latency: metrics.latency,
        userId: params.userId,
        stack: error.stack
      });

      throw error;
    }
  }

  private async preSwapChecks(params: SwapParams) {
    // Check RPC health
    const rpcLatency = await this.checkRPCLatency();
    if (rpcLatency > 5000) { // 5 second threshold
      throw new Error(`RPC_SLOW: ${rpcLatency}ms latency`);
    }

    // Check pool liquidity
    const poolData = await this.dlmmService.getPoolData(params.poolAddress);
    if (poolData.tvl < 50000) { // Minimum $50k TVL
      throw new Error(`LOW_LIQUIDITY: TVL ${poolData.tvl}`);
    }

    // Check for reasonable slippage
    const quote = await this.dlmmService.getQuote(params);
    if (quote.priceImpact > 10) { // 10% max price impact
      throw new Error(`HIGH_SLIPPAGE: ${quote.priceImpact}%`);
    }
  }

  private async checkRPCLatency(): Promise<number> {
    const start = Date.now();
    try {
      await this.dlmmService.connection.getLatestBlockhash();
      return Date.now() - start;
    } catch (error) {
      return 999999; // Return very high latency on error
    }
  }
}
3. Dashboard and Alerting Setup
Copy
// monitoring/Dashboard.tsx
import React, { useState, useEffect } from 'react';
import { sarosMetrics } from './SarosMetrics';

export const MonitoringDashboard: React.FC = () => {
  const [metrics, setMetrics] = useState<any>(null);
  const [alerts, setAlerts] = useState<any[]>([]);

  useEffect(() => {
    const updateMetrics = () => {
      const businessMetrics = sarosMetrics.getBusinessMetrics('day');
      setMetrics(businessMetrics);
    };

    // Update every 30 seconds
    updateMetrics();
    const interval = setInterval(updateMetrics, 30000);

    // Listen for alerts
    const handleAlert = (alert: any) => {
      setAlerts(prev => [alert, ...prev].slice(0, 10)); // Keep last 10 alerts
    };

    sarosMetrics.on('alert', handleAlert);

    return () => {
      clearInterval(interval);
      sarosMetrics.off('alert', handleAlert);
    };
  }, []);

  if (!metrics) return <div>Loading...</div>;

  return (
    <div className="monitoring-dashboard">
      <h2>🔍 Saros Application Monitoring</h2>

      {/* Key Metrics */}
      <div className="metrics-grid">
        <div className="metric-card">
          <h3>Success Rate</h3>
          <div className="metric-value">
            {(metrics.successRate * 100).toFixed(1)}%
          </div>
          <div className={`status ${metrics.successRate > 0.99 ? 'good' : metrics.successRate > 0.95 ? 'warning' : 'critical'}`}>
            {metrics.successRate > 0.99 ? '✅' : metrics.successRate > 0.95 ? '⚠️' : '🚨'}
          </div>
        </div>

        <div className="metric-card">
          <h3>24h Volume</h3>
          <div className="metric-value">
            ${metrics.totalVolume.toLocaleString()}
          </div>
        </div>

        <div className="metric-card">
          <h3>Average Latency</h3>
          <div className="metric-value">
            {metrics.averageLatency.toFixed(0)}ms
          </div>
          <div className={`status ${metrics.averageLatency < 3000 ? 'good' : metrics.averageLatency < 8000 ? 'warning' : 'critical'}`}>
            {metrics.averageLatency < 3000 ? '✅' : metrics.averageLatency < 8000 ? '⚠️' : '🚨'}
          </div>
        </div>

        <div className="metric-card">
          <h3>Average Slippage</h3>
          <div className="metric-value">
            {metrics.averageSlippage.toFixed(2)}%
          </div>
          <div className={`status ${metrics.averageSlippage < 1 ? 'good' : metrics.averageSlippage < 3 ? 'warning' : 'critical'}`}>
            {metrics.averageSlippage < 1 ? '✅' : metrics.averageSlippage < 3 ? '⚠️' : '🚨'}
          </div>
        </div>

        <div className="metric-card">
          <h3>Total Swaps</h3>
          <div className="metric-value">
            {metrics.totalSwaps.toLocaleString()}
          </div>
        </div>

        <div className="metric-card">
          <h3>Active Users</h3>
          <div className="metric-value">
            {metrics.uniqueUsers}
          </div>
        </div>
      </div>

      {/* Recent Alerts */}
      <div className="alerts-section">
        <h3>🚨 Recent Alerts</h3>
        {alerts.length === 0 ? (
          <div className="no-alerts">All systems operational ✅</div>
        ) : (
          <div className="alerts-list">
            {alerts.map((alert, index) => (
              <div key={index} className={`alert alert-${alert.severity}`}>
                <div className="alert-header">
                  <span className="alert-type">{alert.type}</span>
                  <span className="alert-time">
                    {new Date(alert.timestamp).toLocaleTimeString()}
                  </span>
                </div>
                <div className="alert-message">{alert.message}</div>
              </div>
            ))}
          </div>
        )}
      </div>

      <style jsx>{`
        .monitoring-dashboard {
          padding: 2rem;
          max-width: 1200px;
          margin: 0 auto;
        }

        .metrics-grid {
          display: grid;
          grid-template-columns: repeat(auto-fit, minmax(200px, 1fr));
          gap: 1rem;
          margin-bottom: 2rem;
        }

        .metric-card {
          background: white;
          padding: 1rem;
          border-radius: 8px;
          border: 1px solid #e1e8ed;
          text-align: center;
        }

        .metric-card h3 {
          margin: 0 0 0.5rem 0;
          font-size: 0.9rem;
          color: #666;
        }

        .metric-value {
          font-size: 1.8rem;
          font-weight: bold;
          margin-bottom: 0.5rem;
        }

        .status.good { color: #4CAF50; }
        .status.warning { color: #FF9800; }
        .status.critical { color: #f44336; }

        .alerts-section {
          background: white;
          padding: 1rem;
          border-radius: 8px;
          border: 1px solid #e1e8ed;
        }

        .no-alerts {
          text-align: center;
          padding: 2rem;
          color: #4CAF50;
          font-weight: bold;
        }

        .alert {
          padding: 0.75rem;
          margin-bottom: 0.5rem;
          border-radius: 6px;
          border-left: 4px solid;
        }

        .alert-error {
          background: #ffebee;
          border-left-color: #f44336;
        }

        .alert-warning {
          background: #fff8e1;
          border-left-color: #ff9800;
        }

        .alert-header {
          display: flex;
          justify-content: space-between;
          font-weight: bold;
          margin-bottom: 0.25rem;
        }

        .alert-message {
          font-size: 0.9rem;
          color: #666;
        }
      `}</style>
    </div>
  );
};
4. Automated Alerting Integration
Copy
// monitoring/AlertManager.ts
import { sarosMetrics } from './SarosMetrics';

interface AlertChannel {
  name: string;
  webhook?: string;
  email?: string;
  phone?: string;
}

class AlertManager {
  private channels: AlertChannel[] = [];
  private alertHistory: any[] = [];

  constructor() {
    this.setupChannels();
    this.startListening();
  }

  private setupChannels() {
    // Slack integration
    if (process.env.SLACK_WEBHOOK_URL) {
      this.channels.push({
        name: 'slack',
        webhook: process.env.SLACK_WEBHOOK_URL
      });
    }

    // PagerDuty integration
    if (process.env.PAGERDUTY_INTEGRATION_KEY) {
      this.channels.push({
        name: 'pagerduty',
        webhook: `https://events.pagerduty.com/v2/enqueue`
      });
    }

    // Email notifications
    if (process.env.ALERT_EMAIL) {
      this.channels.push({
        name: 'email',
        email: process.env.ALERT_EMAIL
      });
    }
  }

  private startListening() {
    sarosMetrics.on('alert', (alert) => {
      this.processAlert(alert);
    });
  }

  private async processAlert(alert: any) {
    // Avoid alert spam - rate limit similar alerts
    const recentSimilar = this.alertHistory
      .filter(a => a.type === alert.type && Date.now() - a.timestamp < 300000) // 5 minutes
      .length;

    if (recentSimilar > 3) {
      console.log(`Rate limiting alert: ${alert.type}`);
      return;
    }

    this.alertHistory.push({ ...alert, timestamp: Date.now() });

    // Send to all configured channels
    for (const channel of this.channels) {
      try {
        await this.sendAlert(alert, channel);
      } catch (error) {
        console.error(`Failed to send alert to ${channel.name}:`, error);
      }
    }

    // Cleanup old history
    this.alertHistory = this.alertHistory
      .filter(a => Date.now() - a.timestamp < 86400000); // Keep 24 hours
  }

  private async sendAlert(alert: any, channel: AlertChannel) {
    switch (channel.name) {
      case 'slack':
        await this.sendSlackAlert(alert, channel.webhook!);
        break;
      case 'pagerduty':
        await this.sendPagerDutyAlert(alert, channel.webhook!);
        break;
      case 'email':
        await this.sendEmailAlert(alert, channel.email!);
        break;
    }
  }

  private async sendSlackAlert(alert: any, webhook: string) {
    const color = {
      error: 'danger',
      warning: 'warning',
      info: 'good'
    }[alert.severity] || 'warning';

    const message = {
      text: `🚨 Saros Application Alert`,
      attachments: [
        {
          color,
          fields: [
            {
              title: 'Alert Type',
              value: alert.type,
              short: true
            },
            {
              title: 'Severity',
              value: alert.severity.toUpperCase(),
              short: true
            },
            {
              title: 'Message',
              value: alert.message,
              short: false
            },
            {
              title: 'Timestamp',
              value: new Date().toISOString(),
              short: true
            }
          ]
        }
      ]
    };

    await fetch(webhook, {
      method: 'POST',
      headers: { 'Content-Type': 'application/json' },
      body: JSON.stringify(message)
    });
  }

  private async sendPagerDutyAlert(alert: any, webhook: string) {
    const payload = {
      routing_key: process.env.PAGERDUTY_INTEGRATION_KEY,
      event_action: alert.severity === 'error' ? 'trigger' : 'acknowledge',
      dedup_key: `saros_${alert.type}`,
      payload: {
        summary: `Saros ${alert.type}: ${alert.message}`,
        source: 'saros-monitoring',
        severity: alert.severity,
        custom_details: alert.metadata
      }
    };

    await fetch(webhook, {
      method: 'POST',
      headers: { 'Content-Type': 'application/json' },
      body: JSON.stringify(payload)
    });
  }

  private async sendEmailAlert(alert: any, email: string) {
    // Implement email sending using your preferred service
    // (SendGrid, AWS SES, etc.)
    console.log(`Would send email alert to ${email}:`, alert);
  }
}

// Initialize alert manager
export const alertManager = new AlertManager();
5. Health Check Endpoints
Copy
// api/health.ts
import { sarosMetrics } from '../monitoring/SarosMetrics';

export default async function healthHandler(req: any, res: any) {
  try {
    const metrics = sarosMetrics.getBusinessMetrics('hour');

    // Define health criteria
    const isHealthy =
      metrics.successRate > 0.95 && // 95% success rate
      metrics.averageLatency < 10000 && // Under 10s average latency
      metrics.totalSwaps > 0; // At least some activity

    const status = isHealthy ? 'healthy' : 'unhealthy';
    const httpStatus = isHealthy ? 200 : 503;

    const response = {
      status,
      timestamp: new Date().toISOString(),
      metrics: {
        successRate: metrics.successRate,
        averageLatency: metrics.averageLatency,
        totalSwaps: metrics.totalSwaps,
        uptime: process.uptime()
      },
      checks: {
        database: await checkDatabase(),
        rpc: await checkRPC(),
        cache: await checkCache()
      }
    };

    res.status(httpStatus).json(response);

  } catch (error) {
    res.status(503).json({
      status: 'unhealthy',
      error: error.message,
      timestamp: new Date().toISOString()
    });
  }
}

async function checkDatabase(): Promise<boolean> {
  // Implement database health check
  return true;
}

async function checkRPC(): Promise<boolean> {
  // Implement RPC health check
  try {
    const start = Date.now();
    // Your RPC health check logic
    const latency = Date.now() - start;
    return latency < 5000;
  } catch {
    return false;
  }
}

async function checkCache(): Promise<boolean> {
  // Implement cache health check
  return true;
}
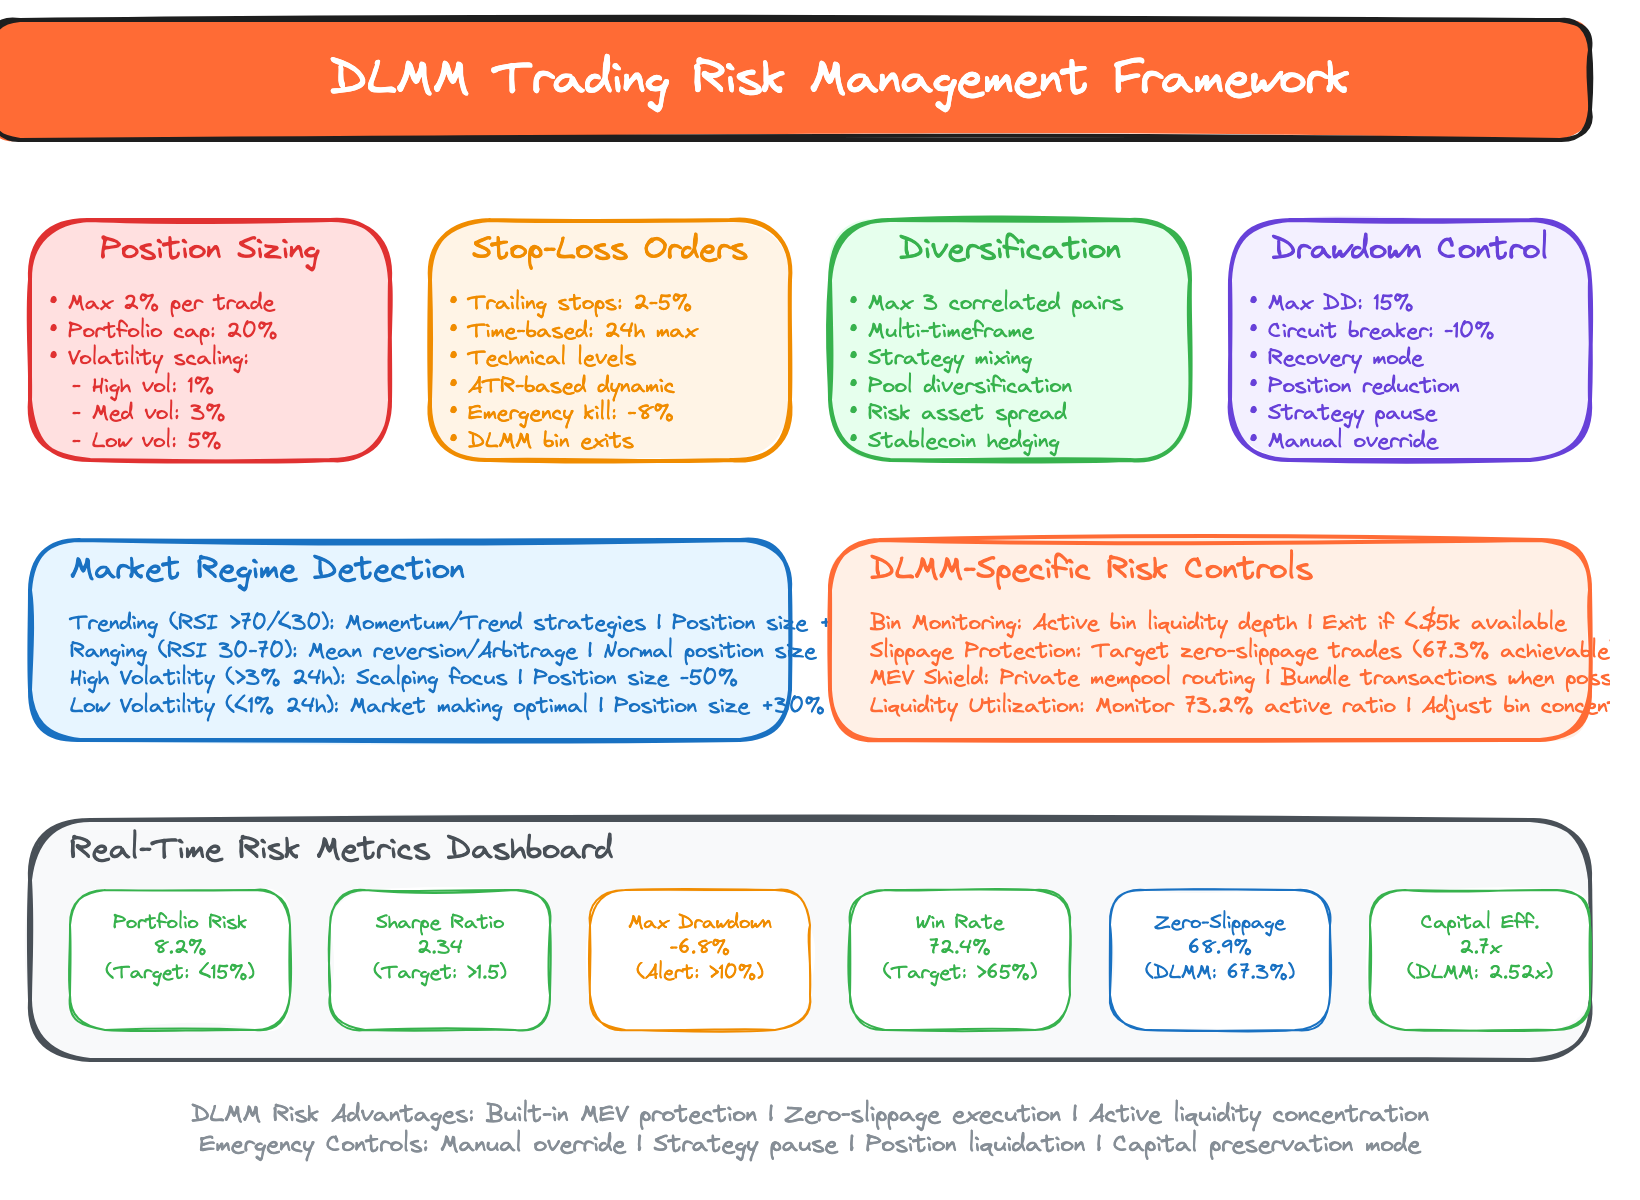
Risk Management Framework
Production Deployment Checklist
✅ Monitoring Infrastructure- Metrics collection implemented
- Alerting channels configured
- Dashboard deployed and accessible
- Health check endpoints working
- Success rate < 95% → Critical alert
- Average latency > 10s → Warning alert
- Price impact > 5% → Warning alert
- Pool TVL < $50k → Warning alert
- RPC latency > 5s → Critical alert
- Daily/weekly volume tracking
- User retention metrics
- Revenue/fee tracking
- Cost per transaction analysis
- Failed authentication attempts
- Unusual transaction patterns
- API rate limiting alerts
- Large transaction alerts